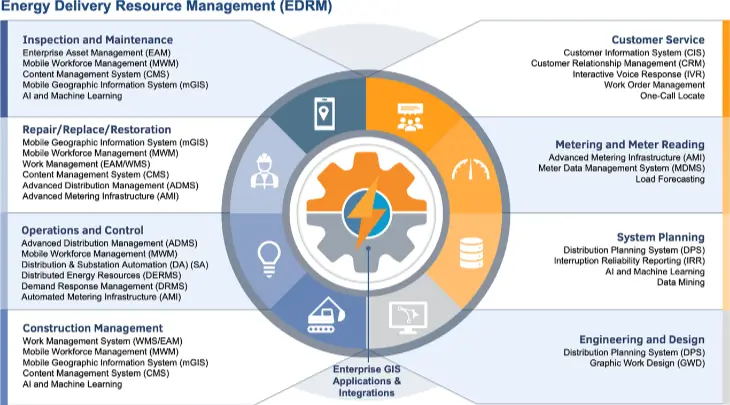
The portfolio of business systems and enabling technologies that make up an Energy Delivery Resource Management (EDRM) suite has continuously been upgraded and added to by utilities over the years. Most EDRM systems were initially deployed by utilities to help improve employee productivity and customer service operations. Working with our digital utility clients, we have found that many have invested in the individual energy delivery business systems and their enabling technologies in the EDRM suite, but most utilities are not leveraging these investments to the fullest with an enterprise approach.
By developing additional integrations across lines of business (LOBs), as well as supplementary enterprise GIS applications that integrate multiple LOB systems, utilities can extend their enterprise technology investments and realize the full benefits of using GIS to support the management and automation of energy delivery on an integrated platform.

This article will discuss how the major technologies, business systems, and high-value integrations support the three main business drivers for adopting an enterprise EDRM portfolio of business systems and enabling technologies. For most energy utilities, the top three business drivers for adopting an EDRM portfolio include:
- Improving Employee Productivity
- Optimizing Assets
- Optimizing Distribution Power Grid Performance
Content Overview
- Improving Employee Productivity
- Engineering and Design and Construction Work Management
- Customer Service
- System Planning
- Optimizing Utility Assets
- Operations and Control
- System Planning
- Optimizing the Performance of the Distribution Power Grid
- ADMS Integrations and Applications
- Self-Healing Grid
- Power Quality Corrections
- Providing Operational Awareness
- Supporting Grid Restoration
- Considerations for Moving to a Web-Enabled Integration Platform
- Maximizing Energy Investments for the Enterprise
1. Improving Employee Productivity
As noted by Figure 1, all utility LOBs have opportunities to improve employee productivity, and most utilities have already made these business system and integration investments. Many of these improvements have been iterated on for 30+ years as they provide support for the core EDRM functions at the utility.
We don’t have the space to cover all the productivity improvements these investments provide. I’ll be covering just a couple of the following workflows and LOBs shown in Table 1 that have been improved with additional business systems, enabling technologies, and integrations.

Productivity – Inspection Maintenance
While Mobile Workforce Management (MWM) systems have been around for more than 30 years, the system scheduling engines have more recently adopted artificial intelligence/machine learning (AI/ML) to improve the scheduling of compliance, surveys, inspections, and routine maintenance work. This is being accomplished by the generation of efficient daily and monthly schedules, the ability of the scheduling engine to reshuffle planned work when incidents occur, and through support for the bundling of work based on locations and qualifications of crews.
The additional integration of Mobile GIS (mGIS) with the MWM mobile platform has provided a more efficient data collection tool for field workers as well. Integration of the Content Management System (CMS) into the mGIS as well as the Mobile Design Technology (MDT) platform provides crews with easy access to jobs, maps, and all related drawings, standard operating procedures, and other related technical documents.
Productivity – Engineering and Design and Construction Work Management
The next standard workflow that has been greatly improved through automation is the processes associated with the Engineering and Design and Construction Work Management LOBs.
The design process is supported primarily by a Graphical Work Design System (GWD) that is integrated with the Work Management System (WMS), Geographic Information System (GIS), Supply Chain Management (SCM), and Distribution Planning System (DPS). The scheduling and dispatching of construction work orders, which is orchestrated by the MWM, needs to first pull job information from the GWD, WMS, GIS, and CMS. The job packages are then sent to a relatively new business system, Digital Construction Management (DCM), for the field crews to record their as-built activities in.
Depending on the level of automation desired by the digital utility, the DCM can also be integrated with the MWM, GWD, GIS, WMS, SCM, Advanced Distribution Management System (ADMS), and CMS to potentially update each of these systems. Integrating the DCM system with your utility’s ADMS is vital for supporting the ADMS’s requirements for zero data latency.
These integrations enable the field to requisition additional materials if needed and collaborate with the engineering department if design modifications are required to update the GIS, WMS, and CMS with the as-built job data collected in the field. The Enterprise Asset Management System (EAM) can also be notified via the MWM of any abnormal operating conditions (AOCs) detected near the job site.
Productivity – Customer Service
The enterprise GIS application that supports the Customer Service LOB provides all active and today’s planned job boundaries that may impact a customer at a specific location. The customer service representative receives the location from the customer with all service orders, maintenance orders, construction orders, outages, planned switching orders, and unplanned active switching orders displayed thematically. This information lets the representative know if a certain customer is part of a planned or unplanned outage or if other utility work in the area may be impacting the quality of the power service.
Productivity – System Planning
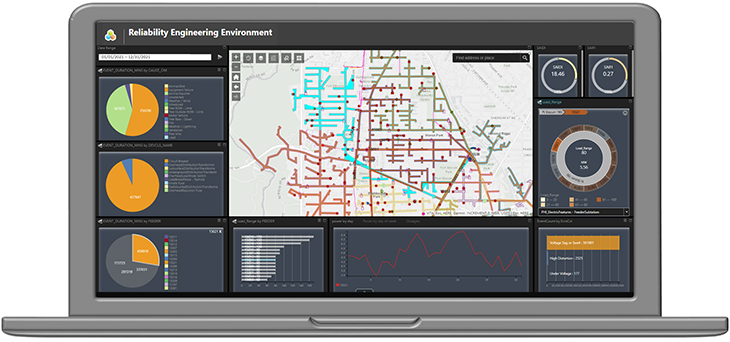
Another enterprise GIS application worth noting impacts the System Planning LOB. It is a reliability engineering GIS application that integrates Advanced Metering Infrastructure (AMI), Outage Management System (OMS), ADMS, Supervisory Control and Data Acquisition (SCADA) Historian, DPS, Distributed Energy Resource Management System (DERMS), Demand Response Management System (DRMS), EAM, Environmental (GIS), and Weather (GIS).
Using the application, the user can perform the following functions:
- Correlate all business system events based on time, location, and portion of the distribution power system affected
- Rebuild the configuration of the distribution power system based on switching and device operation logs at the time of the event
- Recall asset maintenance history and weather events
- Perform outage event and reliability analyses
- Role play ‘what if’ analyses with forecasted reliability based on system improvements user is recommending in a timelier manner than current business processes allow
- Analyze frequency and locations of momentary interruptions to proactively improve power quality issues currently experienced by customers

2. Optimizing Utility Assets
The LOBs that can invest in business systems and integrations to improve asset management range from traditional EAM point device periodic routine inspection and maintenance programs to linear-based subnetwork asset management programs based on how well the complete subcomponent of the power grid is being utilized. These LOBs and workflows are detailed in the below table.

Assets – Inspection Maintenance
The workflow within the Inspection and Maintenance LOB provides both improved asset management as well as employee productivity improvements. The two enabling technologies adopted by this workflow include an image repository and AI/ML models.
Utilities currently have terabytes of drone imagery data from performing inspection surveys and are starting to consider building AI/ML models to extract the assets from the imagery and perform condition assessments. A promising improvement made by some AI/ML service companies is the ability to generate asset photos in a range of asset conditions to self-train the models vs. requiring actual data to train the models on. This enables a pilot or proof of concept to be stood up quickly and allows for the evaluation of the newer AI/ML condition assessment models based on the actual utility’s set of imagery and/or photos.
Assets – Operations and Control
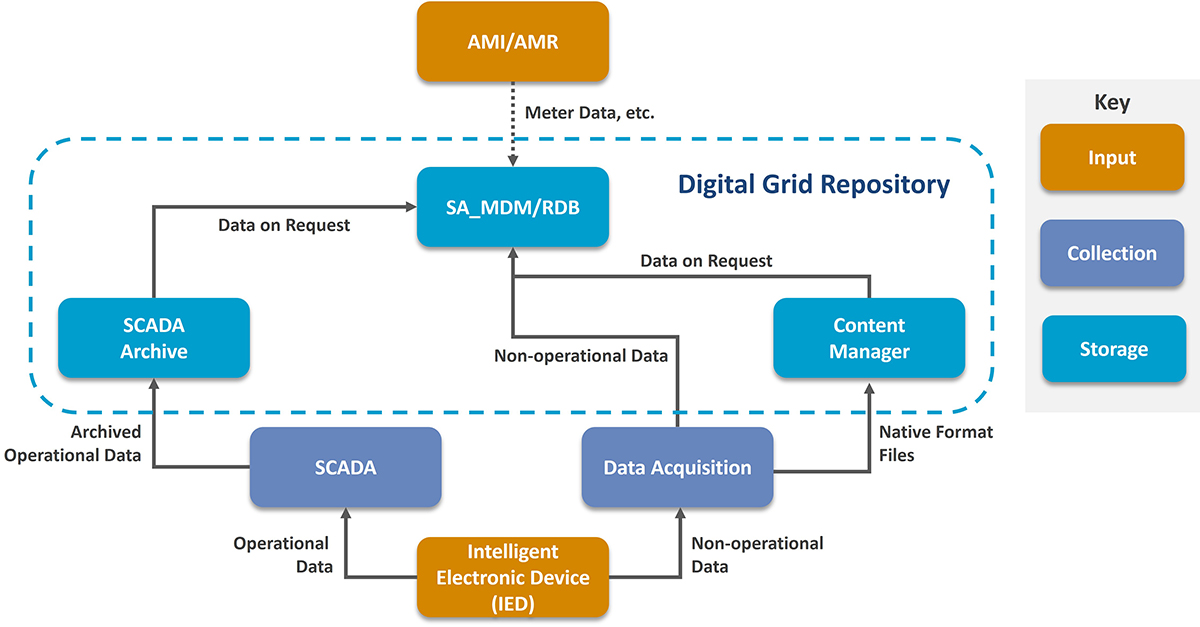
For years, substations have had Intelligent Electric Devices (IEDs) installed in them, but we are now seeing a rapid growth in this direction with IEDs also being installed on feeders and Phasor Measurement Units (PMUs) inside of distribution substations. This expansion will enable the ADMS application Distribution State Estimator (DSE) to become a reality, with most of the ADMS distribution power grid optimization applications leveraging the DSE results.
IEDs support operations with a small amount of information going back via SCADA to support the operations center. They can also monitor the health and wealth of devices on a continuous basis and generate oscillograph data for troubleshooting missed events and the detailed root cause analysis.
However, IEDs typically have not been configured to collect the wealth of information they have the capability to. There has not traditionally been a second communication network back to the enterprise to support the continuous offloading of this information as well as the oscillograph data from the IEDs. If the information is not offloaded, IEDs will overwrite the historical data.
IEDs are also being installed inside of switchgears to monitor the digital footprints of devices along the feeder. Again, utilities have not invested in a continuous ingest platform (Digital Grid Data Repository – DGDR) to collect the data that these IEDs generate.

In addition to having both the substation and line IEDs continuously populate the DGDR with health, wealth, and oscillograph data, the SCADA Historian could also be incorporated. The drone/AI/ML data processing pipeline could input the condition data in the same DGDR along with the historic AMI metering information and human collected asset condition information.
Through these integrations, the utility now has an infrastructure in place (typically a cloud data lake) to continuously collect and apply new AI/ML models and data mining technology to support a combination of asset management paradigms, such as periodic based asset management, condition-based asset management, risk-based asset management, and predicted failure (now based on digital footprints) asset management.
Assets – System Planning
An enterprise Asset Manager GIS application that impacts the System Planning LOB for either analyzing a DGDR or all the individual business systems’ data marts architecturally could look a lot like the Reliability Engineering application introduced above within System Planning enhancements for employee productivity. The application looks at many of the same systems but performs the asset management analysis that suits the appropriate asset management paradigm, such as periodic asset management, condition-based asset management, risk-based asset management, and predicted failure-based asset management (on digital footprints).
Another potential enterprise GIS application supporting the data pipeline processing needed to support the Capital Expenditures (CAPEX) planning process is an Asset Investment Decision Tool (AIDTl), which supports discussing discretionary investments in terms of risk. This type of portfolio optimization tool is becoming available to the market but needs a GIS to organize and correlate the information from the individual business system data marts to the appropriate part of the distribution power grid. This allows executives, engineers, and operations to discuss investments as they impact the utility’s Risk score.
3. Optimizing the Performance of the Distribution Power Grid
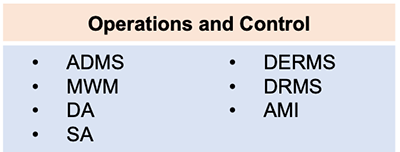
Here we will touch on a few areas of automation within the Operations and Control LOB that support optimization of the distribution power grid’s performance.

ADMS Integrations and Applications
From an integrated suite of systems, an ADMS integrated with a DERMS system that is in turn integrated with the utility’s Power Trading Authority provides a solution that can optimize the grid based on its power system engineering-related characteristics as well as react to the market and optimize the grid based on the financial-related characteristics.
If both ADMS and DERMS systems are integrated with a weather forecasting system, or have their own weather forecasting capabilities, then the solution can proactively optimize for the impact of weather on the grid from the loss of distributive generation capacity. The solution can also forecast the possibility of interruptions based on how the system behaved in previous related weather conditions. If the DERMS system provides for customer demand management, then forecasted power shortages can be offset by invoking customer demand response programs that should be targeted to specific areas of the distribution power grid by the ADMS. However, if the system does not have this capability, then we recommend integrating the ADMS with DRMS to enable the ADMS to direct the DRMS on which Demand Response (DR) programs to schedule for which set of customers.
Self-Healing Grid
In addition to the ADMS applications, such as Fault Location, Isolation, and Supply Restoration (FLISR), both substation automation (SA) and distribution automation (DA) allow the distribution power grid to react to an event and try to self-heal as quickly as possible while serving as many customers as possible still.
Power Quality Corrections
Along with ADMS applications Volt/Var Optimization (VVO) and Conservation Voltage Reduction (CVR), there are distribution devices such as voltage regulators, Static Synchronous Compensator (STATCOM), and Dynamic Volt-Amp Reactive (dVAR) devices that provide power quality corrections when the system or the devices detect a change in the targeted power factor or voltage.
Providing Operational Awareness
The first enterprise GIS application worth discussing to help support the Operations and Control LOB is widespread already, bringing operational awareness to both utility management and its customer stakeholders. The GIS has advanced far enough that a single GIS application can be built to act as the data marshaller of ADMS events to both internal and external stakeholders, so that all stakeholders are getting the same information during a major event.
Supporting Grid Restoration
The next enterprise GIS application allows operations center management to coordinate, recommend, and prioritize the order that the utility’s communication network is restored during a major event. For this to be possible, the GIS application must be integrated with the ADMS for current outages and their extents as well as the OT Communication Network Manager that operates the SCADA communications network and other wireless communication networks that controllable DA and DER devices are connected to. Native GIS functionality, such as heat maps, can be used for enhanced grid visualization by overlaying the Communication Assets with the distribution power grid controllable assets to help prioritize which communication assets need to be restored first.
Considerations for Moving to a Web-Enabled Integration Platform
If your utility has not started looking at web-enabled integration platforms, now is the time to consider moving to a web-based integration framework that supports the transition of business systems from on-premises to the cloud. Your organization should consider moving to one of these platforms to ensure both current and new integrations are developed within a modernized platform that allows for advanced capabilities and workflow automations.
A web integration platform provides services that typically enable these four paradigms at minimum for integrating systems in the cloud, on-premises, and between cloud and on-premises business systems:
- API Management
- Event Bus
- Workflows and Messaging
- Business System Connectors
Other enabling technologies that can help your organization become an advanced digital utility include data lakes, imagery repositories, and AI or ML models.
Maximizing Energy Investments for the Enterprise
Standalone investments in the individual EDRM business systems and their enabling technologies prevent utilities from maximizing the full benefits from these investments. Integration between the systems and technologies along with automations are key to achieving a better return on investment in your EDRM system. As demonstrated by this article, there are many use cases to support the development of enterprise GIS applications that integrate with two or more of the EDRM business systems.
By adopting an enterprise EDRM portfolio, utilities can realize the advanced capabilities of the modern energy delivery platform and become an advanced digital utility.
Connect with UDC to learn more about how you can extend your enterprise technology investments through an enterprise EDRM portfolio.
