
Project Highlights:
- VELCO (VT Transco)
- Headquartered in Rutland, VT
- First “transmission-only” electric operations company in the U.S.
- 55 substations, 700+ miles of transmission lines, and 2,000+ miles of fiber
- Supplies high-voltage power to 17 local distribution utilities in Vermont
VELCO is a transmission-only utility that supplies high-voltage power statewide in Vermont. UDC and VELCO’s engagement started with an Enterprise GIS and ArcGIS upgrade to support modernization efforts. These upgrades marked a significant milestone in the UDC and VELCO partnership and provided a foundation for relaying geospatial and operational data across the organization. After the successful upgrades, VELCO wanted to implement configurable dashboard views for enterprise-wide deployment and use.
In subsequent phases, VELCO’s GIS and AVEVA PI System data were integrated using ArcGIS Experience Builder dashboards and feature services to provide geographic context to sensor data and make data accessible throughout the organization. The PI System database receives near real-time operational data from smart tags across the network, which is then distributed for use by the utility teams or collected and stored for future analysis. Before developing the solution, when reviewing near real-time and historical PI data, VELCO relied exclusively on PI solutions to provide the needed information without spatial context.
Sharing Data to Empower Users
Key business drivers: VELCO is navigating two priorities that shaped this effort. First, the organization aims to obtain 90% of its energy from renewable sources by 2050, a transition that is already changing how the grid is operated. Second, VELCO’s operators, engineers, and planners require timely, reliable data to be accessible across applications as grid conditions continue to evolve.
The main challenge for VELCO was to provide all decision-makers with applications that better support their work by readily displaying the data they need for analysis. This would require transforming the organization’s PI System data into a format that is accessible and meaningful to a broad range of users, thereby empowering them to understand and respond to Vermont’s dynamic grid trends. VELCO wanted to convey near real-time asset information in a spatial format to make data digestible and maximize the number of users who can receive that data. The overall goal was to enable their GIS users to better access that information through their mapping applications.
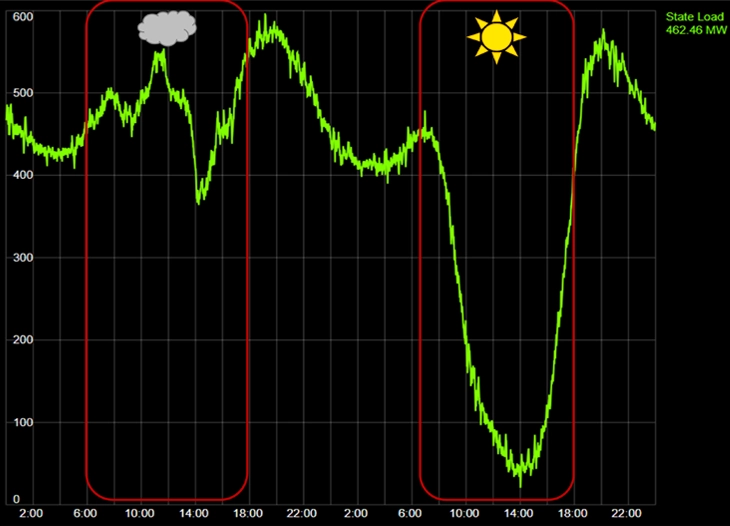
Integrating Historical, Real-Time, and Spatial Data to Derive Insights
UDC collaborated with VELCO to develop solutions for delivering near real-time and historical PI data in combination with geospatial context to users across the organization.
Historical Insights
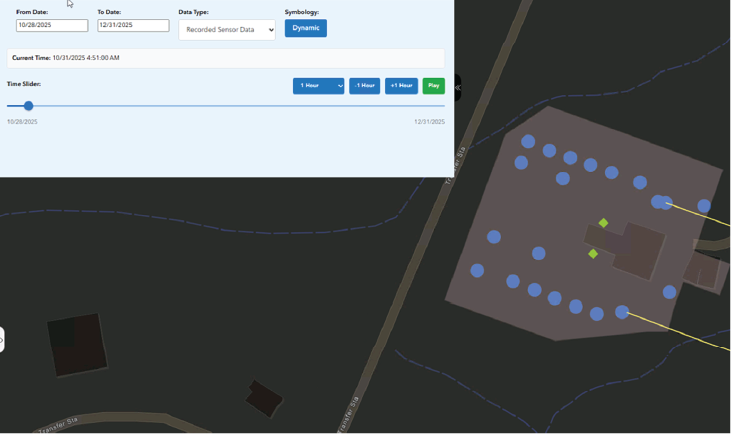
The AVEVA PI System Data Historian collects a vast array of sensor data related to utility equipment and can display and store historical measured values. The result of the GIS and PI integration using ArcGIS Experience Builder included enabling the ability to provide geographic context to the sensor data and incorporate PI widgets and complex sensor readings. Ultimately, combining data from PI and ArcGIS provides spatial context and visualization for grid operations.
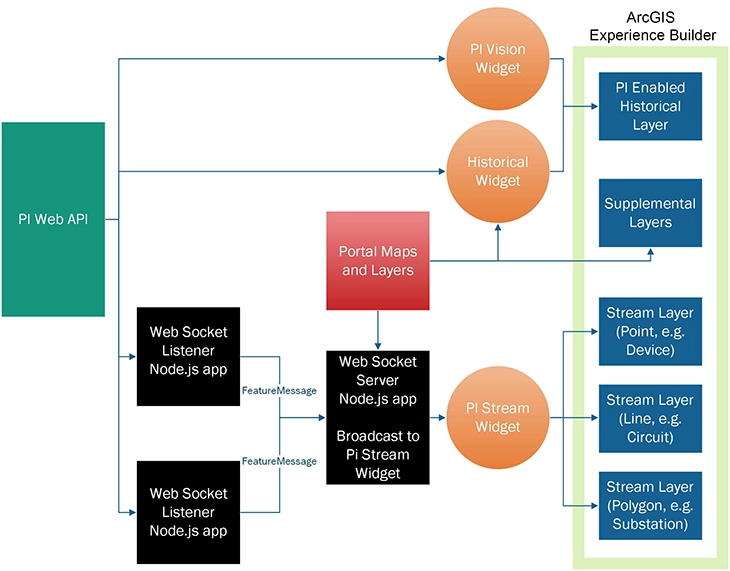
The GIS and PI integration using Experience Builder includes several key components that work together to connect sensor data, historical information, and GIS-based visualization.
- PI Vision Widget: Critical charts and displays generated by the PI system.
- Historical Widget: Historical PI information playback and review. This widget allows you to go back in time to certain event data (set start and end dates to play through).
- PI Stream Widget: Generates and displays near real-time information/alerts that users interact with.
- Portal Maps and Layers: Empowers VELCO to use and rely on existing spatial data layers that the users are accustomed to. When they access the PI data through the application, it allows them to recognize what they use daily.
- Experience Builder: The problem solver, highly configurable and customizable. The Experience Builder offers an application that is accessible to the enterprise and provides dynamic views or dashboards displaying multiple datasets and that are customizable to the viewer.
System Insights
With the goal of presenting near real-time data in a flexible, useful format for a variety of parties, a scalable workflow that creates Esri Feature Services was chosen. This solution turns operational data from the PI System into always-current ArcGIS feature layers with minimal custom configuration for each new feed. A configured Microsoft Windows service refreshes every published layer in step with the near real-time sensor data, so the map is never stale.
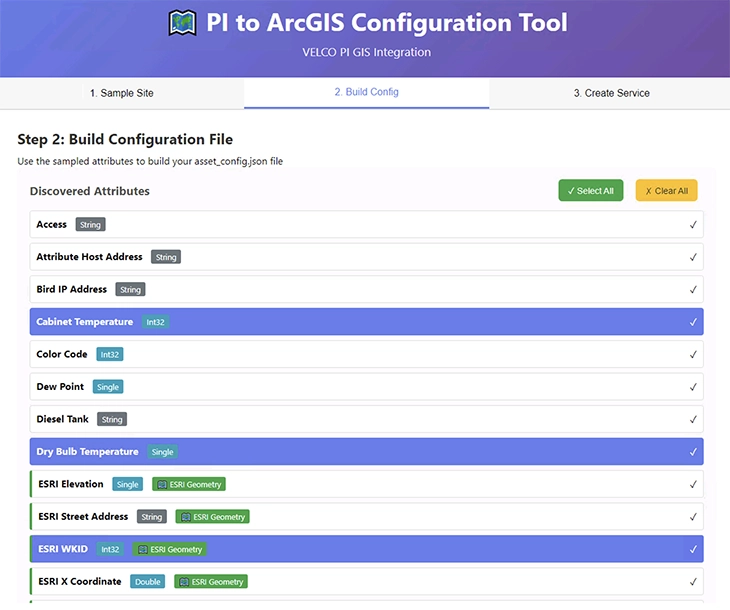
UDC created a self-service configuration interface that generates feature services for teams and stakeholders across VELCO’s organization. The feature services are ready for GIS map consumption and can be incorporated into apps, dashboards, or other means of enabling map views. The new feature layers are made available in ArcGIS Portal.
The GIS administrator can fulfill requests from specific teams in three primary steps using the configuration interface.
- Select fields from the PI database containing information related to the requested data.
- Configure layers to display PI data within GIS – either streaming or static
- Create a feature service for display by most geospatial applications and viewers
Project Team and Approach
UDC collaborated with VELCO team members from GIS Services, Operations, Field Investigators, IT, Applications Development, Cybersecurity, and Database Management. Enabling the desired grid management views, UDC performed the data integrations, developing additional tools from scratch to facilitate the ArcGIS and PI Integration:
- Applications that streamline feature service creation from PI data
- Services that maintain WebSocket connections to the PI data
- Services that update feature services with the near real-time PI data
Making Data Accessible, Dynamic, and Connected
This project created a solution that will, over time, transform how VELCO’s enterprise can capitalize on its near real-time and historical asset data. Data is easily accessible and navigable (all visible on a map via layers), enabling departments across the organization to access near real-time data for their specific use cases. One use case example is radio generation site management.
VELCO has incorporated radio sites throughout Vermont to provide a reliable radio network for operational and emergency communications for VELCO and its electric distribution partners. Radio sites are typically located on mountain tops where adverse weather can compromise power connectivity during periods where utility workers are most reliant on the radio site communications network. Helping to monitor and maintain each site, PI data provides real-time visibility into generator fuel levels and operations. The feature service configuration solution was used to deliver PI data, in combination with geospatial data, to enable operational visualization of radio sites across the network. Users can now see near real-time operations, fuel levels, and locations of these sites, enhancing work prioritization, coordination, analytics, safety, and streamlined management.
Solution Results and Benefits
The integrated dashboard and feature service solutions provide a unique way to connect operational PI data with the ArcGIS environment and improves grid visibility for VELCO users. These views are being used to streamline operations and facilitate effective decision-making, supported by widgets and graphical displays of integrated data and insights. This result is a repeatable, secure pipeline that scales from a single feature class to an entire enterprise of assets, such as Transformers, Transmission Lines, Breakers, and Radio Sites.
Further benefits of the feature service configuration solution include:
- Scales effortlessly: spin up one feature service or a hundred using the same workflow; each feed is self-contained and can be switched on or off independently, with no re-engineering.
- Built for GIS administrators: a point-and-click console replaces custom scripting, so creating and managing feature services is fast, consistent, and approachable.
- Generalized, tool-agnostic outputs: the feature services are standard ArcGIS layers, ready to drop straight into Instant Apps, Dashboards, Experience Builder, Web Maps, or any future app-building tool
- Lightweight and self-sufficient: a single, self-contained background service does the heavy lifting 24/7 with a minimal footprint and no extra runtimes or dependencies to babysit.
Next Steps
Preparing for future solution expansion, UDC is working to make this process as repeatable and user-centric as possible. The newly created dashboard views are now in production. Work will continue to expand beyond the customizable widgets; VELCO plans to create more fully developed web apps from the existing views.
Learn more about the historical dashboards in this Esri IMGIS presentation: Harnessing the Past to Predict the Future at VELCO