GIS has emerged as a powerful tool for helping natural gas companies effectively meet the safety requirements outlined in the Leonel Rondon Pipeline Safety Act. UDC shares insights on how utilities can apply GIS technology to meet these new regulations.
Content Overview
- The Leonel Rondon Pipeline Safety Act
- Pipeline Safety Management Framework
- Distribution Integrity Management and Cast-Iron Risk Assessment
- Managing Leak Surveys
- Supporting MAOP with GIS
- Emergency Communication Protocols
- Building a Natural Gas Outage Management and Communications System
- Natural Gas Incident Command Center
- Written Natural Gas Operating Procedures
- Record Keeping for Gas Distribution Systems
- Proper Support for Monitoring / Regulating Natural Gas Pressure Systems
- Penalties Increased to $20 Million and $200 Million
- Pipeline Safety Management Framework
The Leonel Rondon Pipeline Safety Act
In 2020, U.S. Senator Ed Markey from Massachusetts helped introduce the Leonel Rondon Pipeline Safety Act to enhance the safety and reliability of natural gas pipelines in the United States. Compliance with this act requires natural gas companies to implement comprehensive safety measures, including robust asset management, risk assessment, emergency response planning, regulatory compliance reporting, and public outreach.
The new law includes several provisions for natural gas pipeline operators regarding regulatory compliance as outlined in the summary and included within the text of S.2299 — 116th Congress (2019-2020), Title II: LEONEL RONDON PIPELINE SAFETY ACT.
Based on UDC’s collective team experience, we believe compliance with the Safety Act will require natural gas operators to go beyond the record and maintenance of what’s in the ground. It also entails operators being able to explain and show what was happening in their system at the time of an incident.
Natural gas company technology investments can help to address new regulations and requirements. GIS has evolved into an enterprise-class system. Using GIS data and outputs and adding operational data on top may provide the 24/7/365 as-operating views and transparency regulators seek and support predictive analysis and risk models to help prevent incidents from happening.
Pipeline Safety Management Framework
First and foremost is adopting a pipeline safety management system, which is referenced in Sec. 205. Pipeline safety management systems.
Based on experience, the automation to support pipeline safety management will come from a mix of the following systems integrated with GIS, which is essential to data governance and visualization.

As illustrated above, GIS is central to a holistic system framework that enables natural gas companies to digitally record, visualize, track, and report on their assets and activities while using the applications and systems commonly related to their specific job functions. In addition, when combined with the organization’s technology stack, GIS can enable dynamic operational views of the gas pressure system, providing the ability to see what the system is doing at any point, including before, during, and following an incident.
The Safety Act’s summary points highlight the need to implement many of these capabilities. The following describes how UDC believes GIS technology can address each point.
Distribution Integrity Management and Cast-Iron Risk Assessment
Each distribution integrity management plan (DIMP) developed by an operator of a gas distribution pipeline to include the risks from the presence of cast iron pipes and mains, as well as risks that may result from the operation of a pipeline above the MAOP or maximum allowable operating pressure.
Managing Leak Surveys
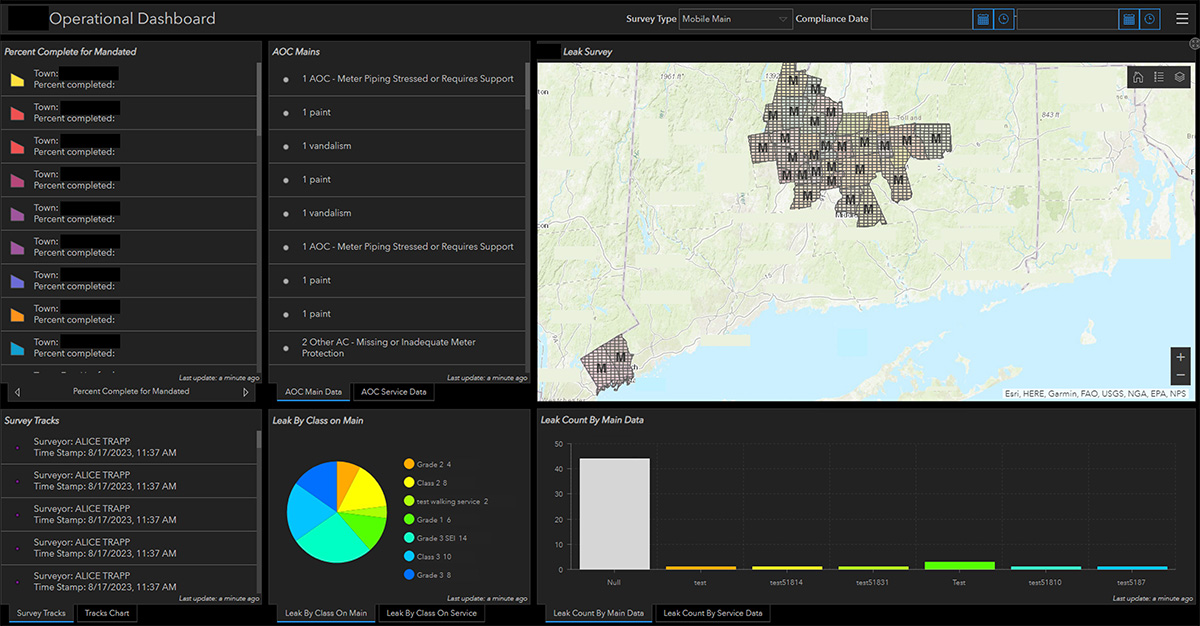
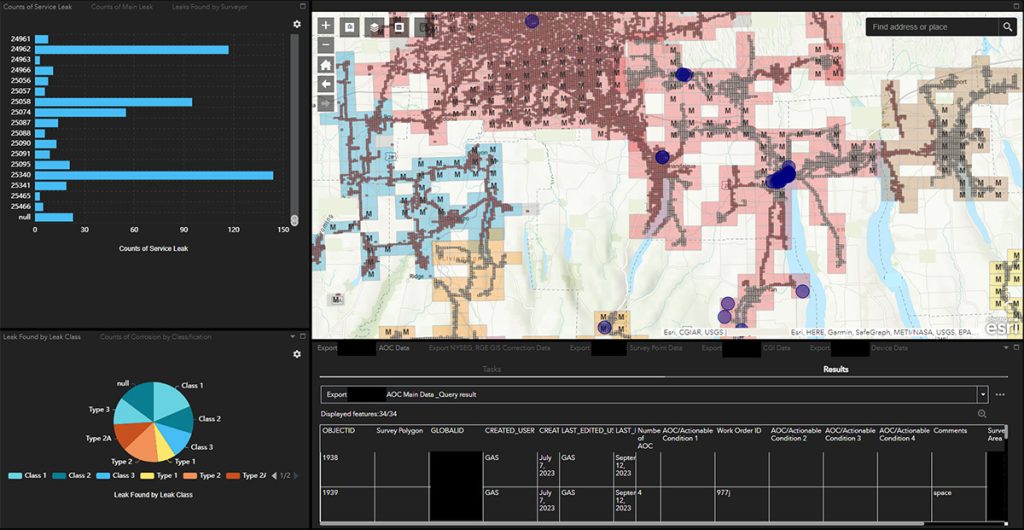
GIS can support natural gas compliance management programs that provide data for DIMP analysis. The GIS can spatially define survey boundaries to drive field compliance surveys, including generating buffer zones around cast iron mains to be sent to the field so technicians can perform their leak surveys using mobile maps and data collection forms built on top of mobile GIS technology. GIS dashboard technology can support planning and monitoring of the status of all natural gas compliance programs—both year-to-date and program-to-date, for multiple-year compliance programs.
Mobile GIS applications can be made “gas smart” to support gas methane detection in the field by configuring them to allow users to record daily calibration of their natural gas sensors that are used to detect emissions and send feedback for prompt cast iron remediation work orders. The application can also include GPS integration to detect if a user is driving faster than the CGI sensor is rated for, reducing survey equipment errors and the need for re-drives.
Supporting MAOP with GIS
A GIS application can be written to calculate the maximum allowable operating pressure, or MAOP, along a main and highlight the weakest segments that drive its MAOP value as a pressure system. Many GIS systems lack the data quality needed to drive the MAOP calculations, so an MAOP Calculator Default Generator application typically needs to be developed. This application provides defaults to be used by the MAOP Calculator if the GIS has null or poor-quality data values in the fields required to drive the MAOP Calculator.
Emergency Communication Protocols
Operators to establish protocols for communicating with fire, police and other relevant public officials after a disaster.
Communication during emergencies requires a multifaceted approach. Establishing channels for communication is just one piece of the solution. Natural gas operators also need the tools to provide real-time situational awareness and operational intelligence to support effective communication with internal management, external stakeholders, and utility customers.
GIS can provide the utility’s target audiences with the appropriate levels of information to make informed decisions. It is foundational to developing a natural gas outage management system (Gas OMS) and building a state-of-the-art natural gas incident command center.
Building a Natural Gas Outage Management and Communications System
Mimic Boards—Internal Management Views. A GIS-based Gas OMS can track and communicate all operations that impact the current configuration of a natural gas pressure system. Integrating with supervisory control and data acquisition for all SCADA operations, the GIS components provide an easy-to-use spatial interface to mirror all field operations that change set points, valve positions, and additions/removals of pinch points/stoppers.
In addition, when integrated with Synergi API, each time a change happens in the field that could impact the pressure system, that edit is sent to Synergi with temperature readings to rerun its calculations. These calculations can then be displayed as annotations on the natural gas pressure system’s as-operating view managed by the Gas OMS and shared via GIS dashboards with internal management, whether inside or outside the OPS center.
An accurate and up-to-date view of the as-operating pressure system based on telemetered and calculated values greatly supports meeting emergency operations and communications requirements. This approach maximizes enterprise investments by integrating GIS and related technologies with SCADA, Synergi, and AMI for those with it.

Natural Gas Incident Command Center
A GIS-based application can also be developed as the organization’s Natural Gas Incident Command Center to support coordinated emergency response. The application could be integrated with trouble call entry, AMI, SCADA, and Threat Analysis applications using artificial intelligence and/or machine learning. This scenario provides a view of areas at risk based on the threat analysis results running continuously in the background.
Typically, internal-facing GIS dashboards would be created for use inside and outside the ops center to see where incidents may have increased the risk to pipeline sections.
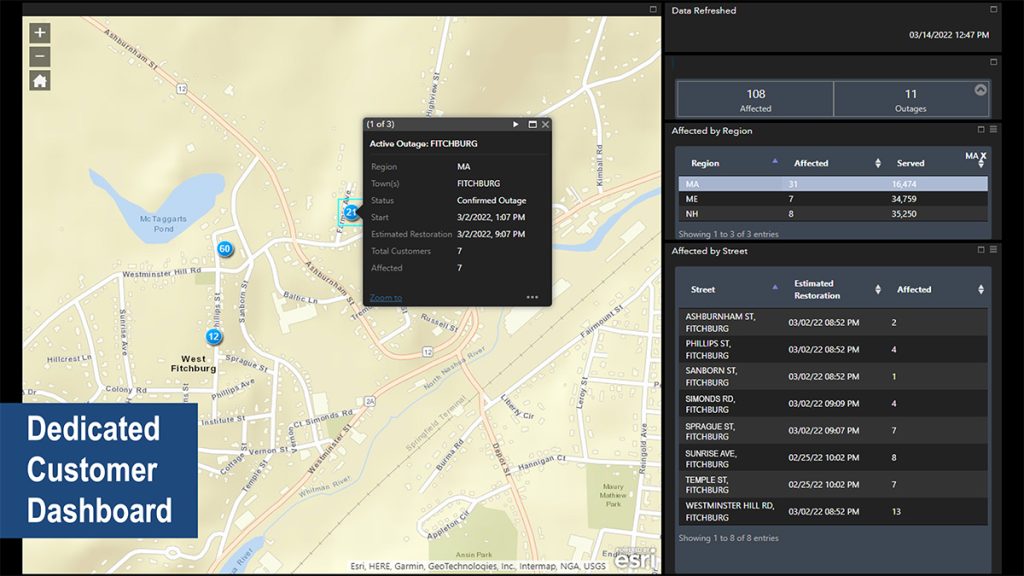
External Dashboards. As a natural gas outage event progresses through the generated nine lifecycle states managed by a Gas OMS (1. Declare Outage; 2. Generate Restoration Lists; 3. Est. Time to Restore; 4. Tag Outs; 5. System Reconfiguration; 6. Repressure; 7. Leak Survey; 8. Relight; 9. Communicate Completion), the status at each state can be further broken down and communicated to the public using an online GIS-based dashboard.
Written Natural Gas Operating Procedures
Procedural manuals for operations, maintenance and emergencies to include certain written procedures.
GIS is crucial in developing emergency procedures because it provides natural gas companies with detailed spatial information. By mapping pipeline locations, nearby structures, population density, and evacuation routes, GIS enables natural gas companies to identify potential hazards and develop effective response strategies.
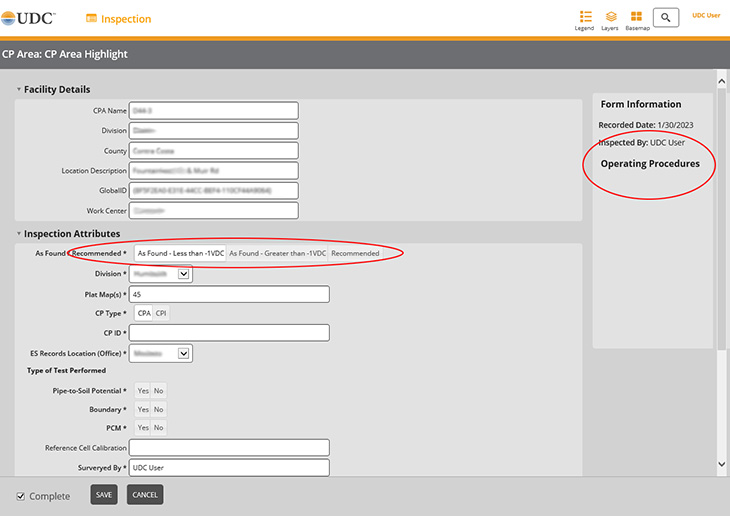
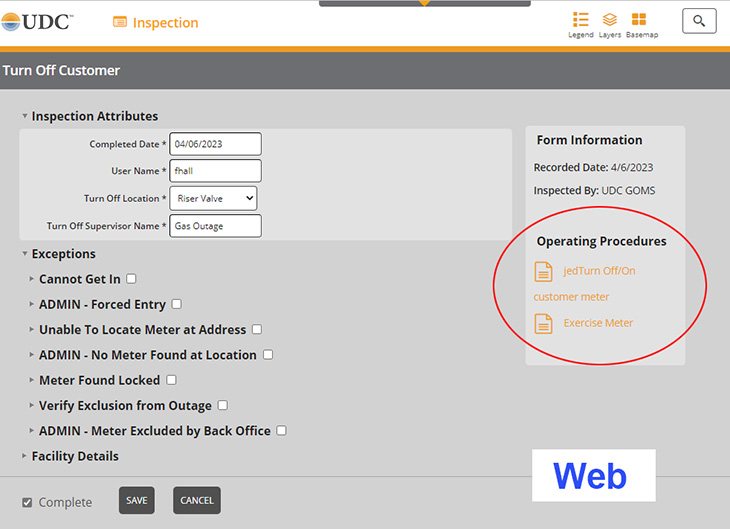
In addition to the requirements for written procedures noted in the summary, Sec 206. of the Act calls for distribution system records to be ‘accessible to all personnel responsible for performing or overseeing relevant construction or engineering work.’ Your GIS tools and applications can support this level of accessibility. Mobile GIS applications can be integrated with enterprise content management systems to provide context-sensitive access to the company’s standard operating procedures, emergency preparedness plans, historical test results, and photographs.
Record Keeping for Gas Distribution Systems
Operators to identify and manage traceable, reliable, and complete, records that are critical to ensuring proper pressure control for a gas distribution system.
Within a GIS application, operators can search from “Point A to Point B along a main,” which can be programmed to return all related work orders, inspections, operations, out-of-band pressure events, and unstructured data available. This search provides the basis for the requested management of gas distribution system records.
Adopting digital workflows and integrated geospatial solutions can maintain the currency and completeness of utility distribution system records and data and support your regulatory reporting for:
- Construction as-built: This helps meet compliance by providing both “GIS to Work Order” and “GIS to Content Management System” traceability.
- Natural gas compliance management: Include status for Program-To-Date, status for Year-To-Date of all programs, same dashboard reporting for all compliance programs for uniformity, and detailed traceability of all abnormal operating conditions raised in the field.
- Natural gas OMS: GIS-based technology supports the recording and playing back of outage events for regulatory reporting and analysis. The system can also display and provide outage management details, including the isolation trace, customers affected, natural gas pressure recordings, natural gas engineering values generated, and critical valve list generation.
Proper Support for Monitoring / Regulating Natural Gas Pressure Systems
The development of standards that promote sufficient staffing for monitoring and regulating gas pressure levels by each operator.
The following diagram overviews the system architecture for building a digital twin of your natural gas distribution system operations to support this requirement. It should be noted that we do not recommend directly using the enterprise GIS system that records the daily as-built information as the platform for the Gas OMS. Instead, we recommend reusing the GIS technology stack inside the ops center, with links to the daily posted natural gas distribution assets, to support effective system monitoring and gas pressure regulation.
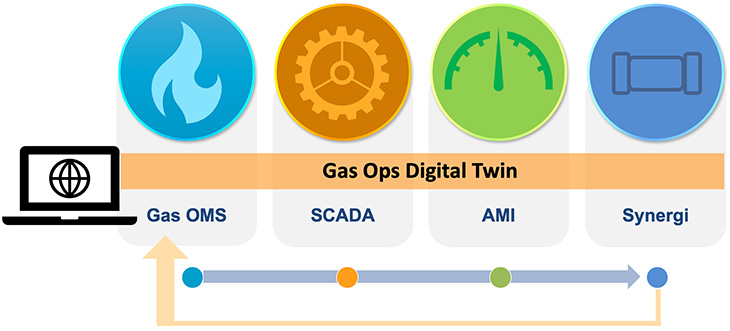
The digital twin solution offers the following functions and benefits:
- Holistic natural gas operations management: Every operation, including all changes in regulating set points, is entered in the Gas OMS and is sent to Synergi (along with current SCADA pressure and temperatures).
- Visualization: Engineering results are generated and displayed in the Gas OMS along the pipeline and at regulator stations. Integration of the Gas OMS with AMI allows for visualization of early emissions detection and changes in pressure.
Penalties Increased to $20 Million and $200 Million
Most notably, within the Leonel Rondon Pipeline Safety Act Section-by-Section legislation, Sec. 7: Civil Penalties calls for increasing penalties for violations by a factor of 100 and adjusting annually for inflation. Coupled with safety implications, understanding this legislation and how to comply is imperative for natural gas operators and distribution organizations.
View the accompanying presentation with AVANGRID and National Grid to learn how GIS is playing a vital role in addressing new requirements for gas operators within their organizations. Contact UDC for more information on how you can leverage enterprise GIS to meet your gas business needs.
