Gas pressure systems are one of the key ways that gas utilities manage their assets. The ability to accurately model gas pressure systems in ArcGIS provides multiple user and system benefits for the gas utility. This blog post will walk you through the processes established by UDC for effectively managing gas pressure systems and providing accessibility, increased awareness, improved issue identification, and ease of system integration.
Content Overview
To begin to properly model gas pressure systems, we asked three key questions:
1. How should we store the information about gas pressure systems in the GIS?
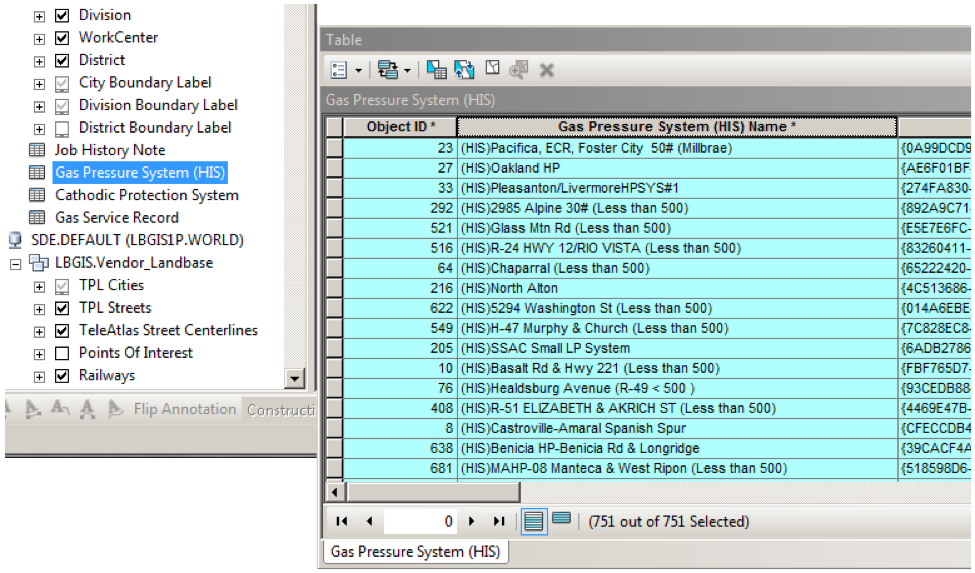
The information is loaded into a table in GIS. This table contains critical data like: the system name, the MAOP (maximum allowable operating pressure), and the NOP (normal operating pressure) of the system.
2. How should we define the boundaries of the gas pressure system visually?
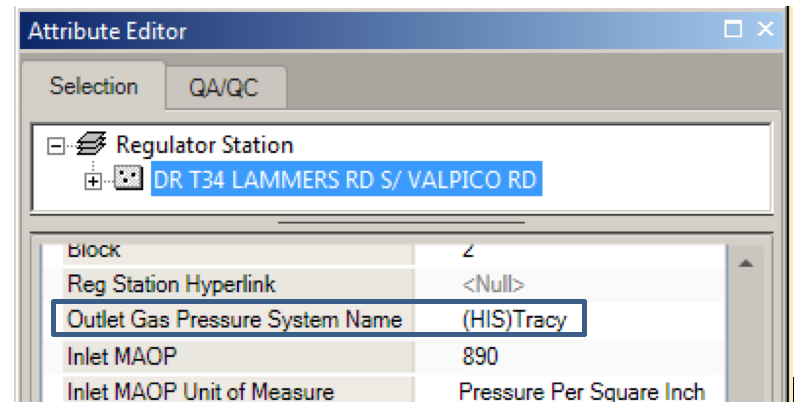
We needed to get the information from the table to features on the map in GIS. To do this, there are two defining characteristics in the GIS. The Regulator Station has an attribute that contains the Gas Pressure System name.
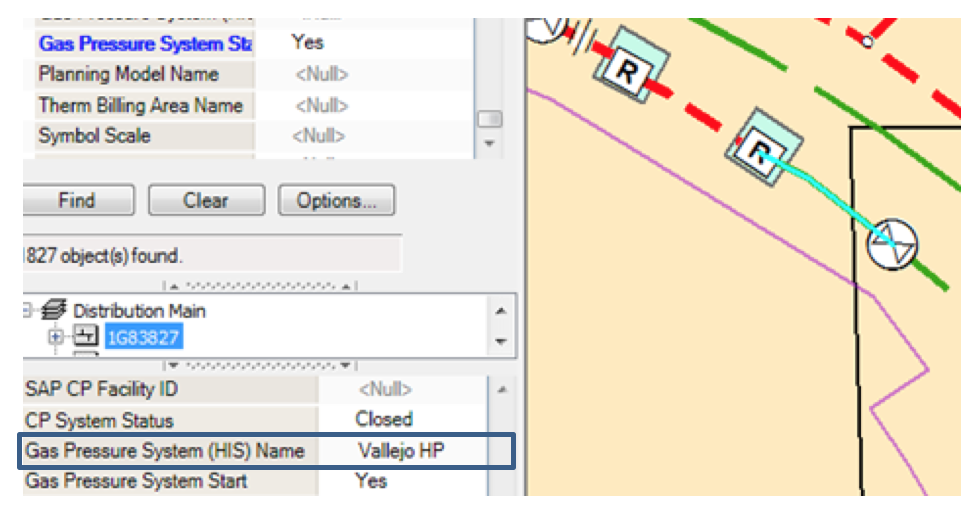
And the first segment of Distribution Main out of the Regulator Station is identified through an attribute.
3. Once you’ve got the table data, and the map data, how do you make sure the gas pressure system is configured correctly?
The user can choose to validate the trace using core tools, such as the ArcFM Gas Pressure System Trace.
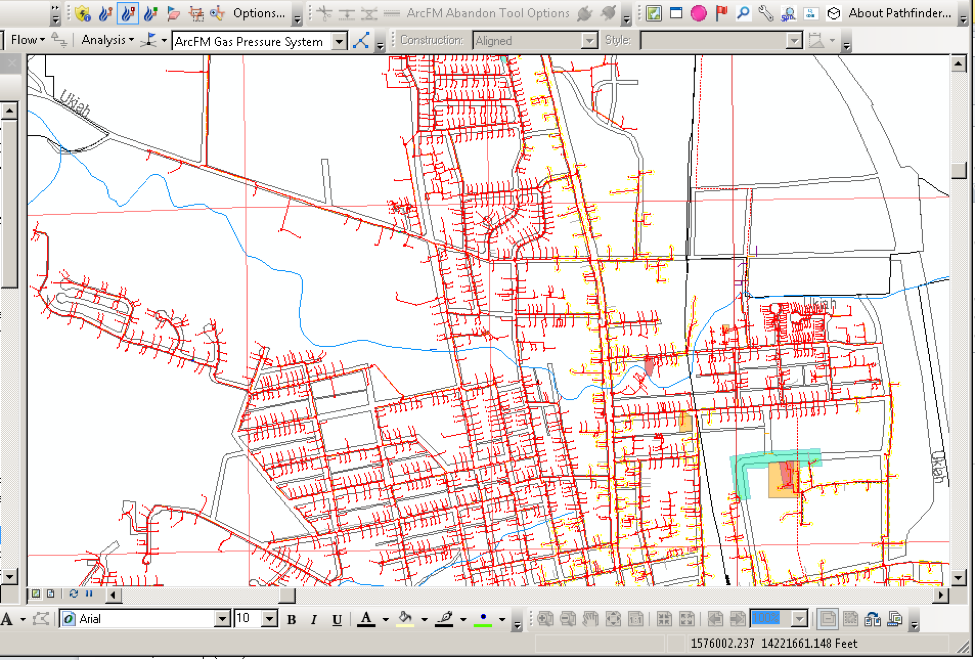
But here’s where we started to get the automation working for us. From this point on, the system does a ton to help the user make sure the gas pressure system is set correctly.
Automated Validation
The system runs a process on a nightly basis to trace designated Gas Pressure Systems. If the trace completes successfully, the system will:
• Calculate the total length of the Distribution Main
• Populate the Gas Pressure System name on the participating Main and Service

In addition, the system automatically checks for the following conditions:
• Increase in Gas Pressure System size
• Decrease in Gas Pressure System size
• No related Regulator Station
• If the trace encounters features associated with another Gas Pressure System (a loop)
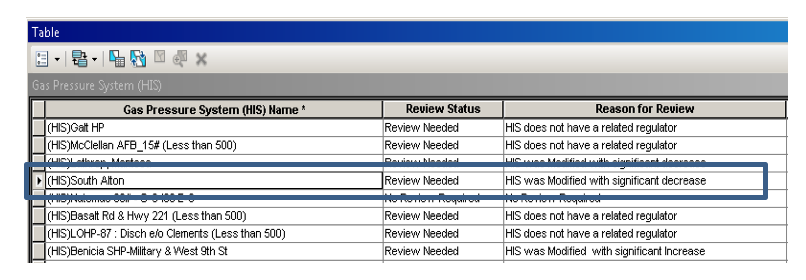
If there is no related system or a loop found, the automated process does not update any of the associated gas pressure system information, but places an error flag on the gas pressure system record in the table.
Once the validation is complete, the system will then populate the Review Status field in the gas pressure system table when the automated process is complete, letting the user know the status of each system.
Visualization for the Enterprise
Once the gas pressure system data has been created, related, and quality checked, the next step is to get the information out to everyone in the enterprise who wants to use it. We leveraged stored displays and relationships to make this possible.
The Distribution Main and Service Feature Classes were joined to the gas pressure system table, using the Gas Pressure System name.
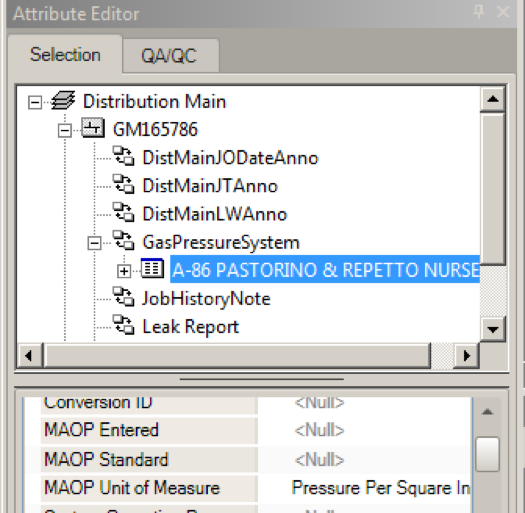
We then created layers that displayed based on the Gas Pressure System name field so that all related pipe displayed in the same color.
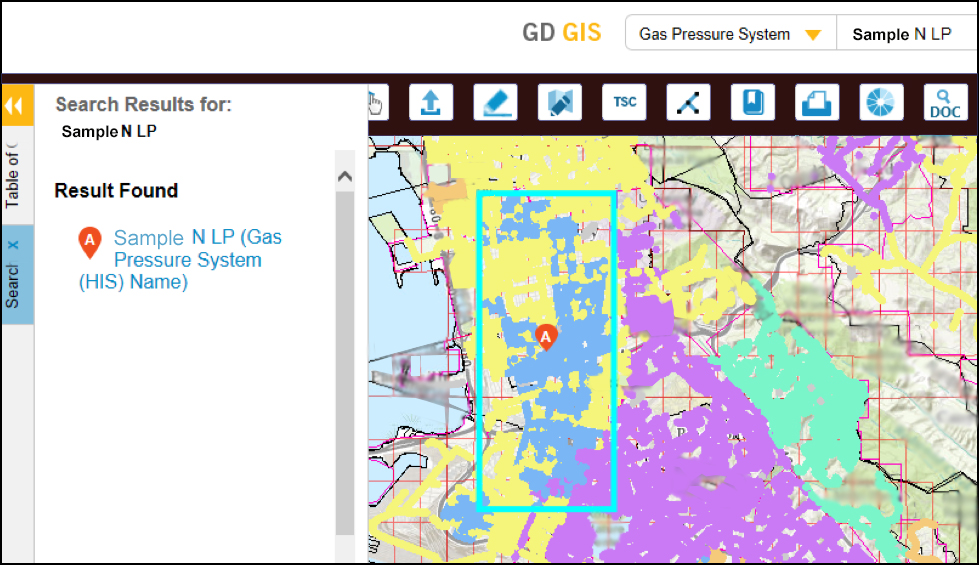
These layers were deployed across the entire Gas Distribution suite of products, including the Web Viewer, Desktop Editor, and Mobile solutions.
Technical Specifications
Some basic details about this solution are below. Please reach out with any specific questions, we’d be happy to give you more information.
- Windows Service written in ArcObjects
- Uses core ArcFM trace functions
- Consistent with the trace functions in ArcMap
- Easy upgrade path to Facility Network
- Regenerates on different conditions
- Regenerate attribute
- Previously determined schedule (configurable)
- Multi-process
- Utilize CPUs on machine
- System updates are made once per day
- Staging table holds all updates to be made
- Updates made during downtime to minimize conflicts/impact
Realized User Benefits
The ability of the gas utility to manage the gas pressure system within ArcGIS utilizing UDC’s management process provides 4 primary benefits lending to increase efficiency and safety overall. These primary realized benefits include:
1. Accessibility
Allows anyone with access to the GD GIS Web Viewer to see Gas Pressure Systems
2. Increased Awareness
Expands the ability to review and understand Gas Pressure Systems to all GD GIS users
3. Issue Identification
Provides insight into the current configuration of Gas Pressure Systems and identifies opportunities for improvement in process
4. Integration
Application is designed to be expandable, and allows for moving Cathodic Protection, Emergency Zone Management, and Leak Survey to a similar model
For more information around how UDC’s established processes can help you effectively manage gas pressure systems in ArcGIS, contact us.
