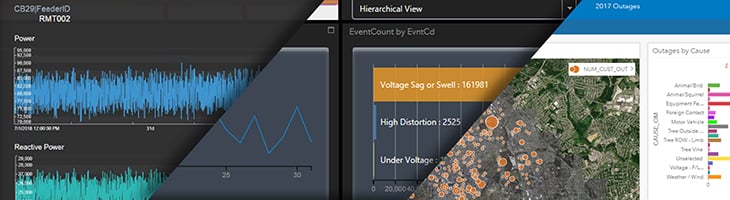
Feeder Sentinel™ is an integrated, interactive dashboard at the foundation of our Digital Utility® Reliability Analysis solution helping utilities to analyze their data from across the organization to make proactive and informed business decisions. The Feeder Sentinel dashboard offers a number of leveraged aspects that make it an optimal fit for your operational particulars. From highly configurable visualization features, to working with data that is real-time, historical, or future projections. Make smarter operational decisions when you can see everything in one place.

Highly Configurable Solution
Exactly what you want to see in your reliability analysis view using the data available to your utility

Visualize Past, Present and Future Operations
Provides visualization of historic, current and forecasted feeder performance for maximum operational effectiveness and customer focused reliability

Instantaneous Feeder Performance Review
Provides an immediate view of feeder performance – no longer spend days or weeks compiling and comparing systems information

AMI Data Compatible
Integrates with AMI data for analysis of poor power quality events so operators can easily correlate issues to operations activity

Leverages Insights for ArcGIS
Interfaces with Esri Insights for ArcGIS supporting ad hoc data analysis

Drives Informed Business Decisions
Assists in capital improvement project design and planning

OSIsoft Compatible
Analyzes and displays PI System data including PI Historian to show actual feeder performance as well as supports reuse of OSIsoft Vision charts and graphs