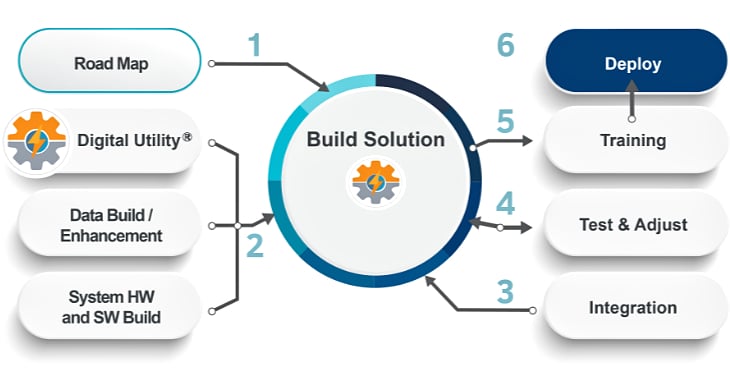
Steps in Implementing Reliability at Your Utility
Every Digital Utility Reliability Analysis Solution implementation follows a process designed to define for each utility what its reliability solution looks like and includes buildout of the desired solution leveraging Feeder Sentinel.

Step One: Road Map
The goal is to mutually develop a fast moving ‘Road Map’ that outlines the Reliability Analysis solution. We use a workshop approach where your solution is defined in relation to each aspect.
The Road Map is all about determining the delta (if any) that must be bridged to have the correct foundations in place and providing documentation around your reliability solution as well as an implementation schedule and budget.
Step Two: Begin Solution Build
The Digital Utility leveraged software is engaged at the start of your Solution Build. In this case, the Feeder Sentinel dashboard is configured and prepared for your utility’s system integrations. Any data, hardware or software needs identified within the solution Road Map are also addressed in this step.
Step Three: Integration
The UDC Reliability Analysis Solution relies on data from your existing systems to drive the analytics in the Feeder Sentinel dashboard application. During Road Map development, we work with you in assessing existing systems, data, and integrations to your existing systems. Those systems are now integrated within your dashboard.
Integrations could include: Outage, AMI, DER, OSIsoft PI Historian, or other systems with key data.
Step Four: Test & Adjust
Solution testing and adjustment is performed via remote access to your environment. Any adjustments are made prior to end user testing.
Step Five: Training
To ensure successful adoption and maximum effectiveness of your Reliability Analysis Solution and Feeder Sentinel dashboard, UDC will provide training tailored to your organization. This may include both onsite and web hosted sessions as well as supporting reference documentation and recorded sessions on the use of your dashboard and its functionality.
Final Step: Deployment
The final step in your Reliability Analysis Solution development is to deploy and provide access for all stakeholders to your Feeder Sentinel dashboard. This can include access via the web using Esri ArcGIS Portal.