As utilities continue to undergo digital transformations and modernize, gas utility DIMP (Distribution Integrity Management Program) managers are exploring ways to improve their DIMP processes through automation and data processing technology.
Highly manual processes, such as plotting aggregated leak detections on a map, require DIMP managers to lean on industry knowledge and familiarity with their pipe systems to help identify which pipes most likely caused the leaks. This ambiguity can make it challenging to determine where the utility’s annual budget can best be spent to improve the gas networks. By automating elements of their DIMP processes, managers can more accurately attribute gas leaks to specific sections of pipes, thus enabling them to plan yearly gas network maintenance with increased precision.
Built on the functionality of Esri’s ArcGIS Pro/ArcGIS Utility Network, UDC’s DIMP Analysis solution, utilizing ArcGIS Web AppBuilder (WAB), equips DIMP managers with a highly efficient and accurate tool for planning yearly capital projects and spending. This first installment in our two-part DIMP blog series will address the functionalities and benefits of the WAB solution component for managing your gas utility DIMP.

Automating Your DIMP
Current utility DIMP processes can include manual buffering and creation of shape files in addition to manual sorting and non-spatial analysis of leak detections using an imported spreadsheet from the legacy management system. This hands-on approach of creating the report can demand 6 – 8 hours for a mid-sized utility, often involving collaboration amongst multiple resources.

UDC’s DIMP Analysis solution accounts for the different models, methodologies, and overall approaches utilities employ for managing their DIMP planning. It marries automation with the tools and workflow your managers already use, optimizing your DIMP without the change management challenges that can accompany new application software. Leveraging the solution, the complete analysis runtime is reduced to less than an hour for a mid-sized utility. If integrated with a utility’s track and trace solution, the application of captured leak repair data would expedite the process even more as well as enable managers to analyze the results in real-time.
Web AppBuilder Features
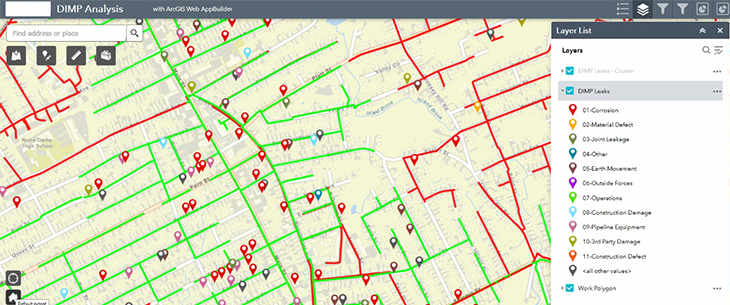
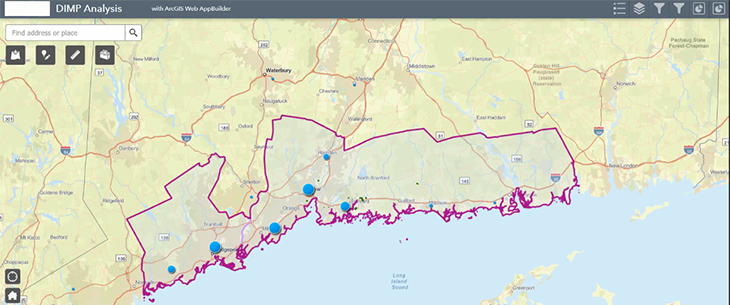
The solution’s WAB interface is driven by the planning process of the individual organization, displaying only the functionalities users need for their utility’s specific DIMP workflow. With less interface functionality than ArcGIS Pro, managers that may lack GIS or ArcGIS Pro technical skills can operate their workflows without additional system training.
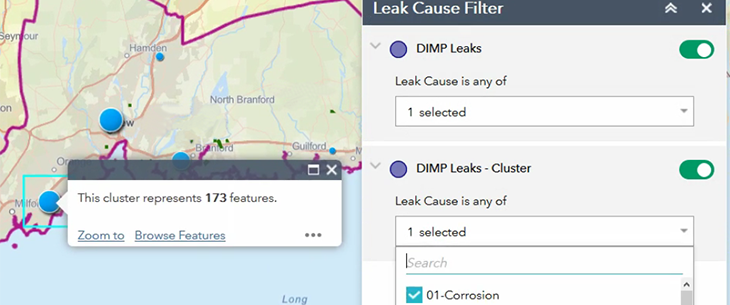
Although the solution is not a dashboard, it has the look and feel of a dashboard, with basic editing tool capabilities that allow for repositioning of the gas leak data. Applied filters visually arrange current and historical data according to classifications, such as ‘Leak Class’ and ‘Types of Leaks’.


Share Information
Since the output layers live in Portal for ArcGIS instead of the database, the solution can be accessed without Model Builder or an ArcGIS Pro license, enabling the information to be easily shared in downstream applications and throughout the entire organization. This capability allows for a system of engagement (SOE) to be implemented without changing the system of record (SOR) or mandating that users engage with the GIS, or have the necessary GIS skills, to leverage the data.
Published Geoprocessing Tool

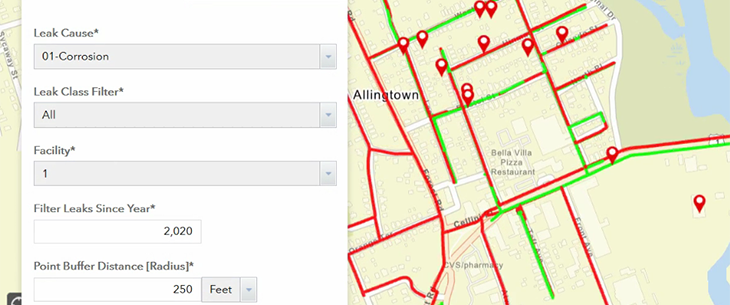
The geoprocessing tool feature eliminates the manual steps of running leak analysis on detected leaks by compiling the detection results in a report for the user. Managers can apply manual logic to make informed planning decisions from the results. Each report can be saved into a feature service which can in turn be appended into additional tools in the ArcGIS Enterprise for further analyses, such as Esri’s ArcGIS Insights.
Pinpoint Clusters
The geoprocessing tool also identifies clusters, or close-proximity leaks with the same root cause according to a predetermined buffer, which can help utilities perform condition-based maintenance on their assets. For example, if the tool identifies three instances of corrosion on the same piece of pipe along the same street, then there is a high probability that pipe is the cause and should be replaced.

Export Results
Reports can be exported to Microsoft Excel from the attribute table and shared post-analysis which can include clusters, relevant street names, etc. Viewing the results in a spreadsheet has the added value of helping the user identify data fidelity issues, such as incorrect street names or locations.
Benefits of Using Web AppBuilder for Your Organization

The WAB-based solution component offers an automated and easy-to-use approach for managing your DIMP. The solution creates a more accurate and efficient method for planning your utility’s yearly system improvement projects by compiling and analyzing the leak data for you, helping you identify the weakest points in your gas system.
The benefits of the DIMP Analysis solution include the following:
- Enhances DIMP planning through automation, saving significant time and costs
- Displays only the ArcGIS Pro interface functionalities your users need
- Looks and feels like a dashboard
- Feeds downstream applications; easily shares information out to entire organization
- Maintains existing DIMP workflows
- Exports reports and summaries to Microsoft Excel
- Saves analysis results as a feature service
- Empowers utilities to perform condition-based maintenance
- Supports users that may not have GIS or ArcGIS Pro experience
To find out more about this solution and how we can help streamline your DIMP processes, please contact us. Read Part Two of our series to learn how Esri’s ArcGIS Insights can take your DIMP to the next level. Download our eBook to discover how each of the 7 compliance elements outlined in PHMSA can be satisfied within an effected DIMP plan.
